3 US Stocks Estimated To Be Trading Below Fair Value
As the United States stock market reaches new heights, buoyed by a robust jobs report and record highs in major indices like the Dow Jones Industrial Average, investors are keenly observing opportunities amid this positive economic sentiment. In such an environment, identifying stocks that might be trading below their fair value can offer potential for growth, especially as the Federal Reserve's monetary policy remains a focal point for market participants.
Top 10 Undervalued Stocks Based On Cash Flows In The United States
Name | Current Price | Fair Value (Est) | Discount (Est) |
MidWestOne Financial Group (NasdaqGS:MOFG) | $27.40 | $53.84 | 49.1% |
Associated Banc-Corp (NYSE:ASB) | $21.02 | $41.74 | 49.6% |
Molina Healthcare (NYSE:MOH) | $330.67 | $641.75 | 48.5% |
Western Alliance Bancorporation (NYSE:WAL) | $84.41 | $168.65 | 50% |
Heartland Financial USA (NasdaqGS:HTLF) | $55.88 | $110.16 | 49.3% |
Cadence Bank (NYSE:CADE) | $31.24 | $61.51 | 49.2% |
Symbotic (NasdaqGM:SYM) | $23.84 | $47.66 | 50% |
EVERTEC (NYSE:EVTC) | $34.22 | $66.42 | 48.5% |
Vasta Platform (NasdaqGS:VSTA) | $2.66 | $5.13 | 48.2% |
Alnylam Pharmaceuticals (NasdaqGS:ALNY) | $267.99 | $518.80 | 48.3% |
Here's a peek at a few of the choices from the screener.
Li Auto
Overview: Li Auto Inc. operates in the energy vehicle market in the People's Republic of China with a market cap of approximately $29.21 billion.
Operations: The company's revenue primarily comes from its Auto Manufacturers segment, which generated CN¥133.72 billion.
Estimated Discount To Fair Value: 15.7%
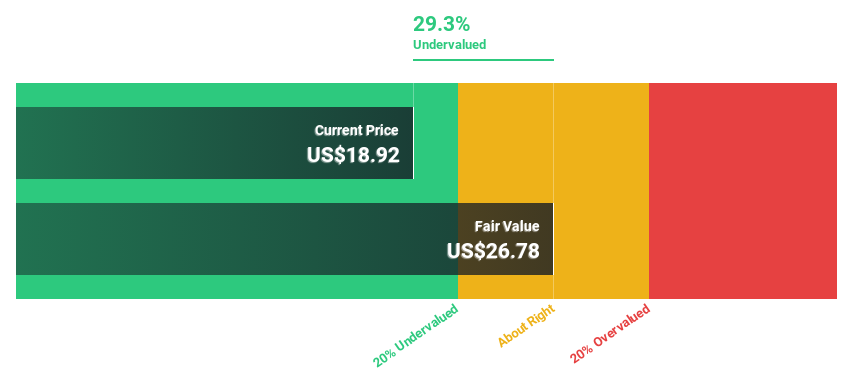
Li Auto, trading at US$29.29, is undervalued relative to its estimated fair value of US$34.73, suggesting potential for investors focused on cash flow metrics. The company has demonstrated robust vehicle delivery growth with 53,709 units in September 2024 alone, marking a 48.9% year-over-year increase. However, while earnings are projected to grow significantly at over 23% annually, the forecasted return on equity remains modest at 18.2%.
Our growth report here indicates Li Auto may be poised for an improving outlook.
Dive into the specifics of Li Auto here with our thorough financial health report.
Marriott International
Overview: Marriott International, Inc. operates, franchises, and licenses hotel, residential, timeshare, and other lodging properties globally with a market cap of approximately $71.68 billion.
Operations: The company's revenue segments include U.S. & Canada, which generated $3.28 billion.
Estimated Discount To Fair Value: 16.3%
Marriott International, priced at US$254.61, is trading below its estimated fair value of US$304.31, indicating potential undervaluation based on cash flows. Despite a high debt level, the company's earnings and revenue are forecasted to grow annually by 6.3% and 23.6%, respectively. Recent strategic expansions include acquisitions and new property openings like the Adelaide Marriott Hotel and The St. Regis Longboat Key Resort, which align with Marriott's growth strategy in emerging markets.
Eli Lilly
Overview: Eli Lilly and Company discovers, develops, and markets human pharmaceuticals worldwide, with a market cap of approximately $798.82 billion.
Operations: The company's revenue is primarily derived from the discovery, development, manufacturing, marketing, and sales of pharmaceutical products, totaling $38.92 billion.
Estimated Discount To Fair Value: 18.8%
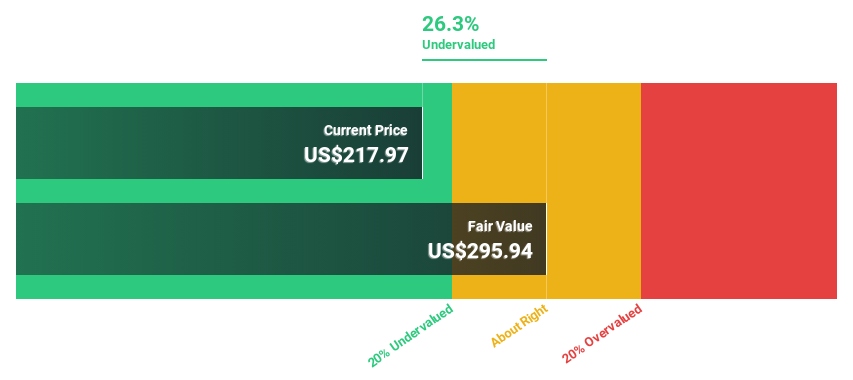
Eli Lilly, trading at US$887.16, is below its estimated fair value of US$1,092.76, suggesting potential undervaluation based on cash flows. Despite its debt not being well-covered by operating cash flow, earnings are forecasted to grow significantly at 28.5% annually over the next three years. Recent investments include a US$4.5 billion Medicine Foundry in Indiana to enhance manufacturing and research capabilities, potentially optimizing costs and expanding production capacity for clinical trials.
Summing It All Up
Click this link to deep-dive into the 191 companies within our Undervalued US Stocks Based On Cash Flows screener.
Have you diversified into these companies? Leverage the power of Simply Wall St's portfolio to keep a close eye on market movements affecting your investments.
Streamline your investment strategy with Simply Wall St's app for free and benefit from extensive research on stocks across all corners of the world.
Seeking Other Investments?
Explore high-performing small cap companies that haven't yet garnered significant analyst attention.
Diversify your portfolio with solid dividend payers offering reliable income streams to weather potential market turbulence.
Fuel your portfolio with companies showing strong growth potential, backed by optimistic outlooks both from analysts and management.
This article by Simply Wall St is general in nature. We provide commentary based on historical data and analyst forecasts only using an unbiased methodology and our articles are not intended to be financial advice. It does not constitute a recommendation to buy or sell any stock, and does not take account of your objectives, or your financial situation. We aim to bring you long-term focused analysis driven by fundamental data. Note that our analysis may not factor in the latest price-sensitive company announcements or qualitative material. Simply Wall St has no position in any stocks mentioned.
Companies discussed in this article include NasdaqGS:LI NasdaqGS:MAR and NYSE:LLY.
Have feedback on this article? Concerned about the content? Get in touch with us directly. Alternatively, email [email protected]


