September Is the Worst Month For Stocks. But Should You Sell?

Michael M. Santiago / Getty Images
Key Takeaways
September is the only calendar month to average a negative return over the past 98 years.
However, over the last century, the S&P 500 has been positive in September more often than it has been negative.
Equities have tended to perform better in the Septembers leading up to a presidential election.
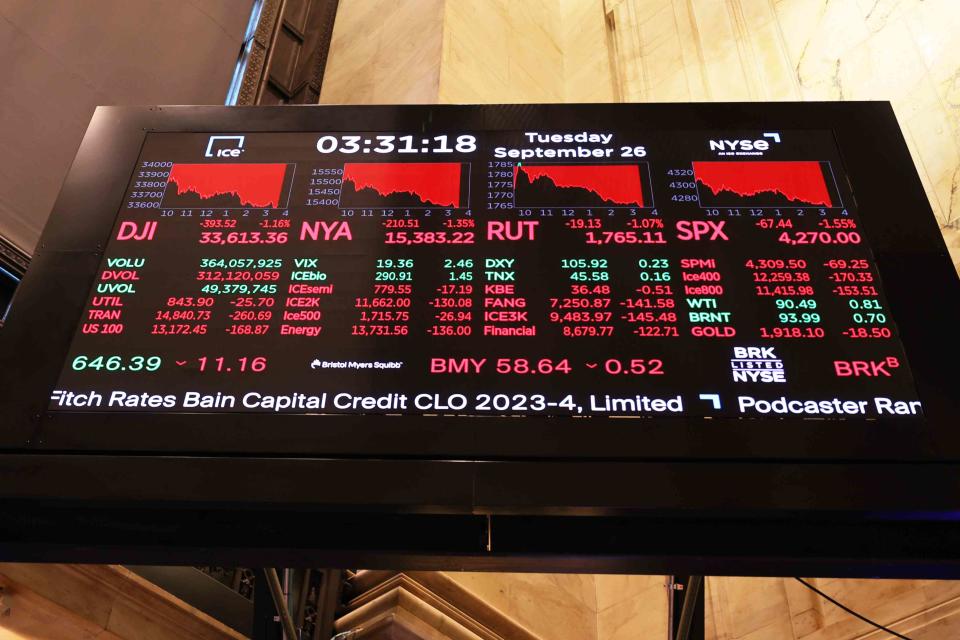
Markets have been on edge this week, with stocks slumping to start what is historically Wall Street’s worst month.
The September Effect refers to the stock market’s historical underperformance during the month. According to Ryan Detrick, Chief Market Strategist at advisory firm Carson Group, September has been the market’s worst-performing month in the last 10 years, 20 years, and since 1950. According to Fisher Investments, it is also the only month to average a negative return since 1925 (-0.78%).
What Are the Reasons Behind the September Effect?
Several theories exist to explain this historical pattern. One posits that traders, returning to work from summer vacations, rebalance portfolios in September, increasing selling volume and putting pressure on stock prices.
Another theory suggests that bond offerings pick up in September as summer vacations wind down; those bond sales attract money that would otherwise have supported stock prices. Still another blames mutual funds, whose fiscal years typically end on Oct. 31. Funds, the theory suggests, close out losing positions in the last months of their fiscal year for tax purposes.
None of these explanations are airtight. While trading activity does tend to dip during peak vacation months, algorithmic trading and the mobility of work in the age of smartphones have somewhat blunted the impact summer vacations have on stocks. And research has shown that mutual funds tend to anticipate the price pressures of seasonal selling and adjust accordingly.
A Few Bad Septembers Spoil the Month
September's bad reputation appears to stem more from a few unfortunate years than from a specific cause. In September 1931, the height of the Great Depression, the S&P 500's precursor lost 29.6%, its worst month on record. Another bad September came in 2008, when the benchmark index lost nearly 9% as Lehman Brothers collapsed. (The index was expanded to 500 companies in 1957.)
Given the anomalous nature of September returns, there’s plenty of reason to stay in the market. Over the past century, stocks have risen in September slightly more often than they’ve fallen (51% vs. 49%), meaning sitting out the month is hardly a guarantee of success.
In fact, September’s median return, which neutralizes positive and negative outliers, is exactly 0% over the last 98 years, according to Fisher Investments.
The September Effect in Election Years
This year, investors concerned about September may be even more anxious due to the elephant (and donkey) in the room: the upcoming presidential election. Uncertainty about its outcome could hang over stocks for the next two months.
However, historically, presidential elections have not made September worse for stocks. Stocks have advanced in nearly a third (62.5%) of Septembers heading into a presidential election (15 of the 24 elections since 1925). That’s substantially better than its overall average and only one percentage point below the all-month average. September’s median return in presidential election years is 0.3%.
That said, markets respond daily to viewpoints on the health of the economy and investor expectations, not historical patterns. Investors' evaluations of this specific election cycle and the perceived consequences of each candidate's economic proposals could affect stocks' performance this month.
Alongside the election, several other uncertainties loom. The health of the labor market, inflation and the Federal Reserve’s next moves are far more likely to drive action in stocks this month than the idea of a September Effect.
AMPLIFICATION: This article, first published on Sept. 3, 2024, has been updated to note that the S&P's benchmark index first included 500 companies in 1957.
Read the original article on Investopedia.