Top TSX Dividend Stocks For September 2024
Over the last 7 days, the Canadian market has dropped 2.3%, driven by pullbacks in the Energy and Materials sectors of 4.8% and 6.4%, respectively, though it is up 12% over the past year with earnings forecast to grow by 15% annually. In this context, a good dividend stock can offer stability and income potential even amid short-term market fluctuations, making them an attractive option for investors seeking reliable returns.
Top 10 Dividend Stocks In Canada
Name | Dividend Yield | Dividend Rating |
Whitecap Resources (TSX:WCP) | 7.53% | ★★★★★★ |
Secure Energy Services (TSX:SES) | 3.56% | ★★★★★☆ |
Power Corporation of Canada (TSX:POW) | 5.46% | ★★★★★☆ |
Enghouse Systems (TSX:ENGH) | 3.40% | ★★★★★☆ |
Canadian Natural Resources (TSX:CNQ) | 4.66% | ★★★★★☆ |
Russel Metals (TSX:RUS) | 4.63% | ★★★★★☆ |
iA Financial (TSX:IAG) | 3.16% | ★★★★★☆ |
Firm Capital Mortgage Investment (TSX:FC) | 8.65% | ★★★★★☆ |
Sun Life Financial (TSX:SLF) | 4.37% | ★★★★★☆ |
Royal Bank of Canada (TSX:RY) | 3.46% | ★★★★★☆ |
Click here to see the full list of 33 stocks from our Top TSX Dividend Stocks screener.
We're going to check out a few of the best picks from our screener tool.
North West
Simply Wall St Dividend Rating: ★★★★★☆
Overview: The North West Company Inc. (TSX:NWC) operates retail stores providing food and everyday products to rural and urban communities in northern Canada, rural Alaska, the South Pacific, and the Caribbean, with a market cap of CA$2.45 billion.
Operations: The North West Company Inc. generates CA$2.52 billion in revenue from retailing food and everyday products and services to its diverse markets.
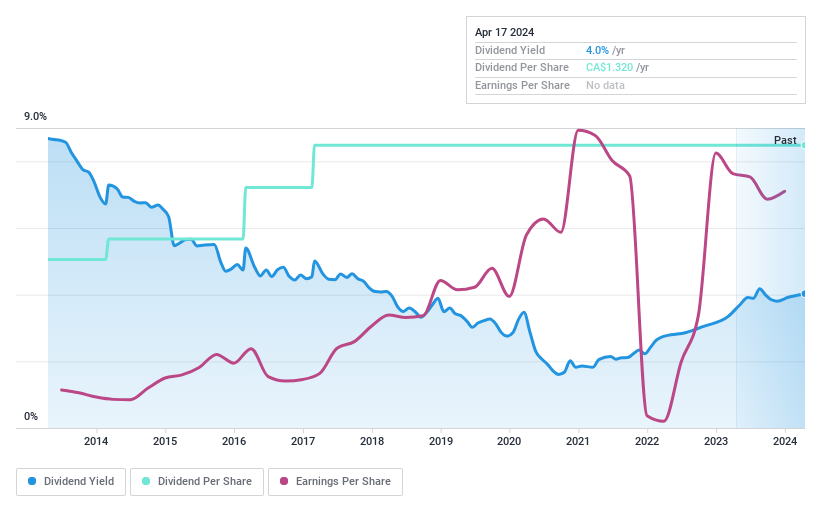
Dividend Yield: 3.2%
North West pays a reliable dividend of CAD 0.40 per share, recently increased by 2.6%. Its dividends are well-covered by earnings (56.2% payout ratio) and cash flows (72.9% cash payout ratio). While the dividend yield of 3.16% is lower than top-tier Canadian payers, North West's payouts have been stable and growing over the past decade. Recent earnings showed modest growth with Q2 sales at CAD 646.49 million and net income at CAD 35.3 million.
Olympia Financial Group
Simply Wall St Dividend Rating: ★★★★★☆
Overview: Olympia Financial Group Inc., with a market cap of CA$240.63 million, operates in Canada through its subsidiary, Olympia Trust Company, as a non-deposit taking trust company.
Operations: Olympia Financial Group Inc. generates revenue through various segments including Health (CA$10.21 million), Corporate (CA$0.13 million), Exempt Edge (EE) (CA$1.41 million), Investment Account Services (IAS) (CA$79.02 million), Currency and Global Payments (CGP) (CA$8.43 million), and Corporate and Shareholder Services (CSS) (CA$3.98 million).
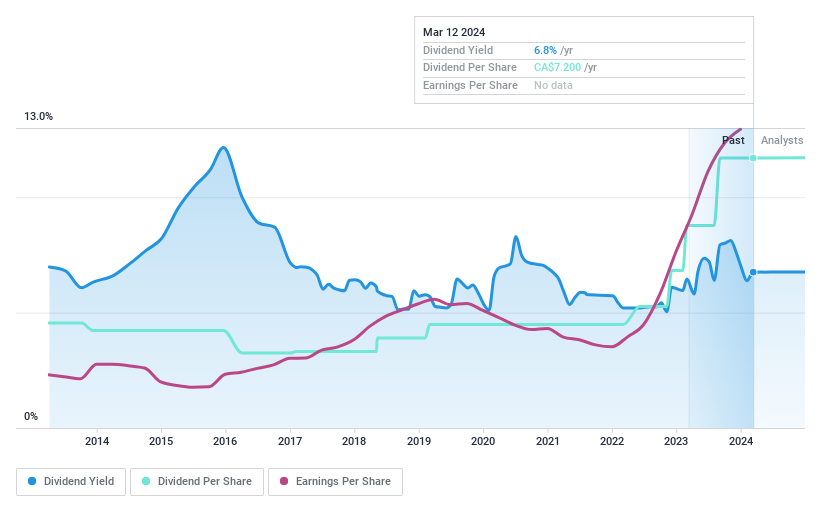
Dividend Yield: 7.2%
Olympia Financial Group's dividend yield of 7.2% is among the top 25% in Canada, with a reasonable payout ratio of 68.1%, covered by both earnings and cash flows. Despite volatile dividends over the past decade, payouts have increased recently. Q2 2024 revenue was CAD 26.25 million, up from CAD 25.1 million a year ago, while net income slightly declined to CAD 5.89 million from CAD 5.97 million last year.
Richards Packaging Income Fund
Simply Wall St Dividend Rating: ★★★★★☆
Overview: Richards Packaging Income Fund, with a market cap of CA$334.13 million, designs, manufactures, and distributes packaging containers and healthcare supplies across North America.
Operations: Richards Packaging Income Fund generates CA$415.52 million in revenue from its Wholesale - Miscellaneous segment.
Dividend Yield: 4.3%
Richards Packaging Income Fund offers a reliable dividend yield of 4.33%, though it falls short of the top 25% in Canada. Its dividends are well-covered by earnings, with a payout ratio of 56.4%, and cash flows, with a low cash payout ratio of 20.6%. Recent affirmations show consistent monthly distributions at CAD 0.11 per unit. Q2 2024 results reported stable sales at CAD 107.41 million and increased net income to CAD 11.8 million from CAD 10.91 million last year.
Summing It All Up
Click through to start exploring the rest of the 30 Top TSX Dividend Stocks now.
Hold shares in these firms? Setup your portfolio in Simply Wall St to seamlessly track your investments and receive personalized updates on your portfolio's performance.
Join a community of smart investors by using Simply Wall St. It's free and delivers expert-level analysis on worldwide markets.
Ready To Venture Into Other Investment Styles?
Explore high-performing small cap companies that haven't yet garnered significant analyst attention.
Fuel your portfolio with companies showing strong growth potential, backed by optimistic outlooks both from analysts and management.
Find companies with promising cash flow potential yet trading below their fair value.
This article by Simply Wall St is general in nature. We provide commentary based on historical data and analyst forecasts only using an unbiased methodology and our articles are not intended to be financial advice. It does not constitute a recommendation to buy or sell any stock, and does not take account of your objectives, or your financial situation. We aim to bring you long-term focused analysis driven by fundamental data. Note that our analysis may not factor in the latest price-sensitive company announcements or qualitative material. Simply Wall St has no position in any stocks mentioned.
Companies discussed in this article include TSX:NWC TSX:OLY and TSX:RPI.UN.
Have feedback on this article? Concerned about the content? Get in touch with us directly. Alternatively, email [email protected]


