This Is Why Evergy, Inc.'s (NASDAQ:EVRG) CEO Compensation Looks Appropriate
Key Insights
Evergy to hold its Annual General Meeting on 7th of May
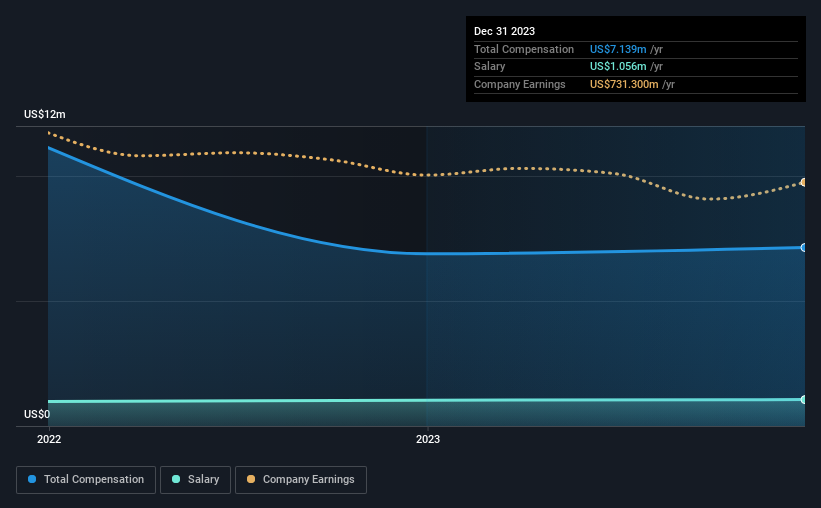
Salary of US$1.06m is part of CEO David Campbell's total remuneration
The total compensation is 47% less than the average for the industry
Evergy's three-year loss to shareholders was 8.1% while its EPS grew by 5.4% over the past three years
The performance at Evergy, Inc. (NASDAQ:EVRG) has been rather lacklustre of late and shareholders may be wondering what CEO David Campbell is planning to do about this. At the next AGM coming up on 7th of May, they can influence managerial decision making through voting on resolutions, including executive remuneration. Setting appropriate executive remuneration to align with the interests of shareholders may also be a way to influence the company performance in the long run. We have prepared some analysis below to show that CEO compensation looks to be reasonable.
See our latest analysis for Evergy
How Does Total Compensation For David Campbell Compare With Other Companies In The Industry?
According to our data, Evergy, Inc. has a market capitalization of US$12b, and paid its CEO total annual compensation worth US$7.1m over the year to December 2023. That's a modest increase of 3.6% on the prior year. While we always look at total compensation first, our analysis shows that the salary component is less, at US$1.1m.
For comparison, other companies in the American Electric Utilities industry with market capitalizations above US$8.0b, reported a median total CEO compensation of US$14m. In other words, Evergy pays its CEO lower than the industry median. Moreover, David Campbell also holds US$4.7m worth of Evergy stock directly under their own name, which reveals to us that they have a significant personal stake in the company.
Component | 2023 | 2022 | Proportion (2023) |
Salary | US$1.1m | US$1.0m | 15% |
Other | US$6.1m | US$5.9m | 85% |
Total Compensation | US$7.1m | US$6.9m | 100% |
On an industry level, around 11% of total compensation represents salary and 89% is other remuneration. It's interesting to note that Evergy pays out a greater portion of remuneration through salary, compared to the industry. If non-salary compensation dominates total pay, it's an indicator that the executive's salary is tied to company performance.
A Look at Evergy, Inc.'s Growth Numbers
Evergy, Inc.'s earnings per share (EPS) grew 5.4% per year over the last three years. It saw its revenue drop 6.0% over the last year.
We would prefer it if there was revenue growth, but the modest EPS growth gives us some relief. It's hard to reach a conclusion about business performance right now. This may be one to watch. Moving away from current form for a second, it could be important to check this free visual depiction of what analysts expect for the future.
Has Evergy, Inc. Been A Good Investment?
With a three year total loss of 8.1% for the shareholders, Evergy, Inc. would certainly have some dissatisfied shareholders. So shareholders would probably want the company to be less generous with CEO compensation.
To Conclude...
It may not be surprising to some that the recent weak performance in the share price may be driven in part by rather flat EPS growth. The upcoming AGM will provide shareholders the opportunity to raise their concerns and evaluate if the board’s judgement and decision-making is aligned with their expectations.
CEO compensation is an important area to keep your eyes on, but we've also need to pay attention to other attributes of the company. We identified 2 warning signs for Evergy (1 is potentially serious!) that you should be aware of before investing here.
Important note: Evergy is an exciting stock, but we understand investors may be looking for an unencumbered balance sheet and blockbuster returns. You might find something better in this list of interesting companies with high ROE and low debt.
Have feedback on this article? Concerned about the content? Get in touch with us directly. Alternatively, email editorial-team (at) simplywallst.com.
This article by Simply Wall St is general in nature. We provide commentary based on historical data and analyst forecasts only using an unbiased methodology and our articles are not intended to be financial advice. It does not constitute a recommendation to buy or sell any stock, and does not take account of your objectives, or your financial situation. We aim to bring you long-term focused analysis driven by fundamental data. Note that our analysis may not factor in the latest price-sensitive company announcements or qualitative material. Simply Wall St has no position in any stocks mentioned.
