Where earnings estimates come from: Yahoo U
For more business and finance explainers, check out our Yahoo U page.
When it comes to company performance, earnings are always about meeting expectations. After a company releases its quarterly results, analysts often use “beat” or “miss” to describe the over-performance or under-performance relative to “the street’s estimates.”
What do analysts estimate?
The broadest performance metrics across companies are revenue and earnings per share.
A typical income statement will list net revenue (or net sales) at the top of the document, which represents the total money made off of selling whatever service or good the company offers (subtracted by any returns, hence “net”). Because of the line item’s placement on the income statement, revenue is often referred to as the “top line.”
But of course, no company operates for free. So analysts also care about how much money the company has left after subtracting any expenses, or “net income.” Because net income is at the bottom of the income statement, it is often referred to as the “bottom line.”
Earnings per share (EPS) is an alternative measure of net income that adjusts the figure for the amount of shares outstanding. EPS is an oft-referenced figure that represents the potential return to shareholders (if the company, for example, wanted to pay out dividends or buyback shares).
These two figures are major metrics that analysts want to estimate.
Who comes up with the estimates?
Earnings estimates most commonly come from analysts, often working at investment banks or investment firms, who dedicate themselves to “covering” and researching specific stocks.
Their research often involves modeling out forecasts for how a given company might perform in the future.
Using their own math, analysts will publish estimates for figures like revenue and EPS. Aggregator services like Bloomberg, FactSet, S&P Capital IQ, and Refinitiv collect the various estimates and combine them into a “consensus” estimate, which traders and reporters use to gauge if a company “beat” or “missed” expectations.
How good is it for a company to beat expectations? How bad is it to miss?
It’s not as simple as stocks go up when companies beat expectations and stocks go down when companies miss.

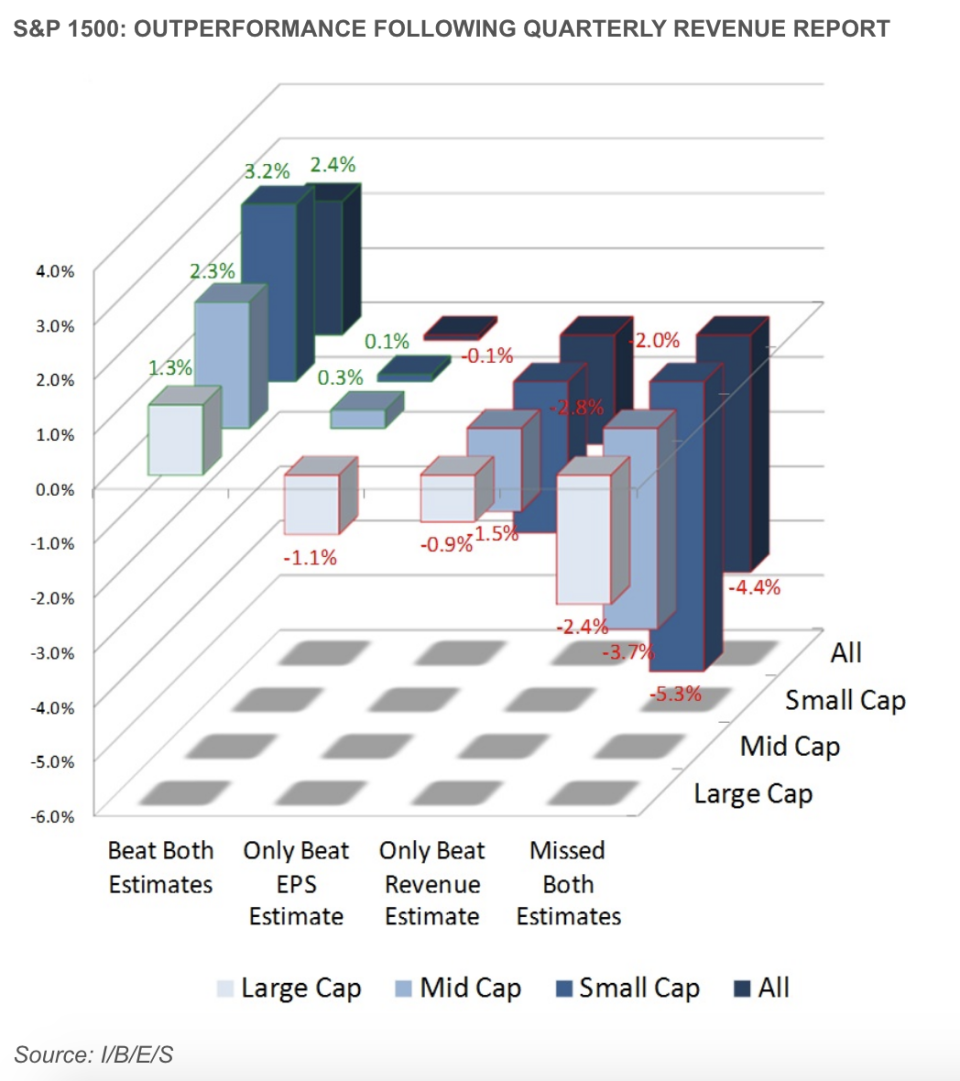
Data from Refinitiv shows that it is indeed the case that if an S&P 1500 company beats both revenue and EPS estimates, its stock would outperform the broader index by 2.4% in the day after releasing its earnings (as of 2014).
And conversely, if an S&P 1500 company missed both revenue and EPS estimates, its stock would underperform the broader index by 4.4% in the day after its announcement.
But interestingly, a company with “mixed” earnings results will get different stock reactions depending on what metric it missed on.
A company that only beat on EPS didn’t appear to get any boost or punishment, performing only 0.1% below the broader index in the day after announcing earnings.
But a company that only beat on revenue tended to face an adverse day of trading after releasing its results, underperforming the market by 2.0%.
The differences are also stratified by company size; smaller companies tend to see more pronounced over-performances when beating on both the top and bottom line. They also saw more pronounced under-performance when missing on both metrics.
Are revenue and EPS the most important metrics?
No, they’re just the most universal metrics to compare.
Analysts have estimates for plenty of other metrics, ranging from financial line items like free cash flow to more concrete figures like unit sales (think Tesla), gross bookings (think Uber and Lyft), or video subscribers (think Netflix).
More Yahoo U segments:
Read the latest financial and business news from Yahoo Finance
Follow Yahoo Finance on Twitter, Facebook, Instagram, Flipboard, SmartNews, LinkedIn, YouTube, and reddit.
