YIELD CURVE INVERTS: Recession indicator flashes red for first time since 2005
The market’s most closely watched part of the yield curve inverted today, and if its record over the last half-century is any indicator, the U.S. could be headed for a recession soon.
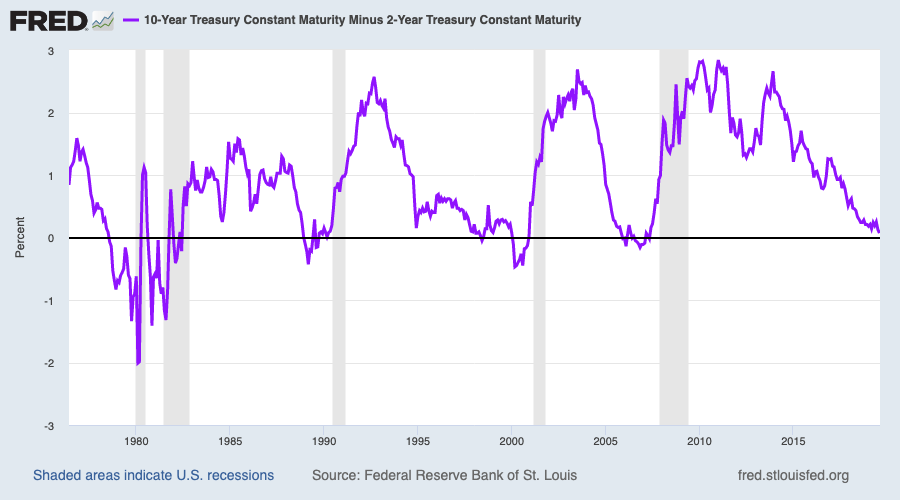
Shortly after 6 a.m. ET on Wednesday, the yield on the 10-year U.S. Treasury bond dipped below the yield on the 2-year U.S. Treasury as the 10-year fell 1 basis point below the 2-year. The yield curve inversion has a strong track record of predicting a recession; each of the last seven recessions (dating back to 1969) were preceded by the 10-year falling below the 2-year.
Ahead of the last recession, the yield curve inverted briefly as early as December 27, 2005, about two years before the financial crisis sent the economy into recession.
For over a year after that, the yield curve fluttered in and out of inversion. The last inversion, as measured by U.S. Treasury data collected by the St. Louis Fed, was in 2007.

Concerns over a global slowdown, in addition to uncertainties from the U.S.-China trade war, have weighed heavily on longer-term U.S. Treasury yields. Since the new year, the return on the longer-term 30-year Treasury has fallen from a high of 3.12% in March to 2.08% on August 14.
Bond yields across the board have come down over that same time period, as investors move funds from more aggressive-yielding securities into risk-off assets like gold and U.S. Treasuries.
Yields came down precipitously in August amid a mix of global concerns: President Donald Trump threatened new tariffs on China, an Argentinian election renewed worry over its debt crisis, and protests escalated in Hong Kong.
Morgan Stanley wrote August 12 that unless economic data or U.S. equity earnings turn around, “the bear is alive and kicking.” Their note adds that investors should be careful about equity markets, recommending staples and utilities stocks amid recession risks.
“Growth stocks look more vulnerable than defensives,” Morgan Stanley wrote.
In an August 13 note, Bank of America Merrill Lynch warned that equity investors should not expect the stock market to turn sour immediately, as the S&P 500 has a tendency to experience a “last gasp rally” to a new peak after dipping.
BAML points out that it can take between eight to 24 months for a recession to hit after the 2-year and 10-year curve inverts. They warned that an inverting yield curve means equities are on “borrowed time.”
Fed action
The Federal Reserve may have hoped that cutting rates in its July 31 meeting would have helped the yield curve steepen, since the shorter end of the curve closely tracks where the federal funds rate is.
The day after the Fed lowered rates, the 2-year bond did come down and widened slightly against the 10-year, extending the spread to 17 basis points.
But trade developments the Monday after clobbered bonds and began the fall into inversion, raising questions about whether or not Fed would be backed into a corner and forced to aggressively cut rates in its remaining meetings this year.

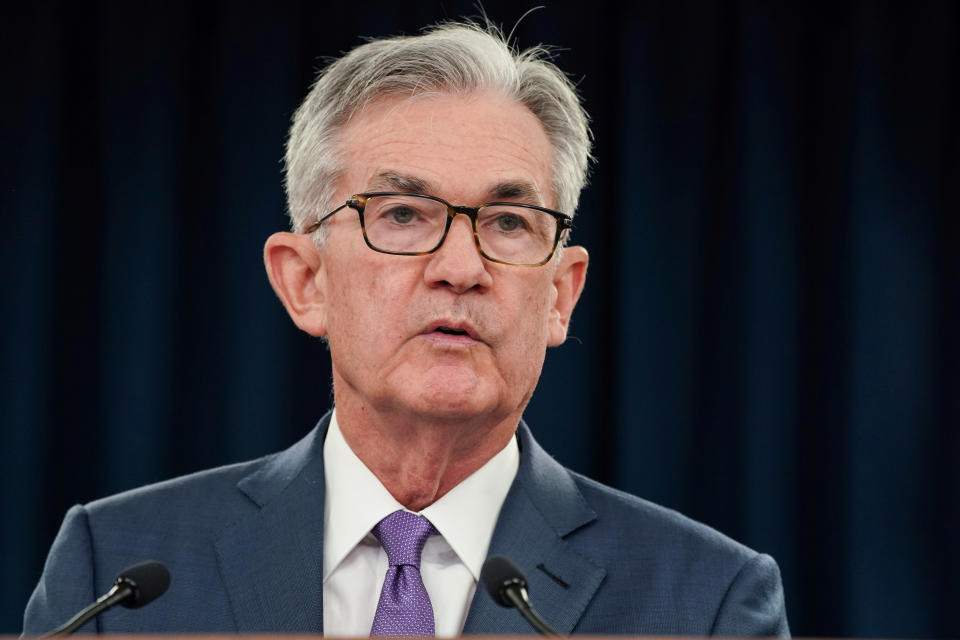
Fed Chairman Jerome Powell has grappled with interpreting the yield curve over the past few months. In early July, Powell told Congress that bond markets “reflected the real concerns that arose really beginning in May,” referencing the slowdown in U.S. business investment and broader global concerns abroad.
On that day, July 11, the spread between the 2-year and the 10-year was 28 basis points. Powell attributed the curve’s shape to the central bank’s signal in its June 19 meeting that it could cut rates.
“We’ve signaled that we’re open to doing that,” Powell said in reference to the rate cut that eventually came a few weeks later. “You’re seeing that in the curve now.”
The yield curve
The inversion of the 2-year and the 10-year reflects bearish expectations for the economy.
Bond yields are driven by demand, and the more demand there is for a given bond, the lower the yield will be (since the security would not need to pay out as much for investors to want it). When economic conditions deteriorate, investors may pour money into longer-term Treasuries (10-year) due to concern over events that could transpire in the short-term. Thus, shorter-term Treasuries (2-year) would offer a higher yield compared to the more desired longer-term bonds.
Other parts of the curve have already inverted. In December, the yield on the 5-year Treasury note fell below the yield on the 3-year note. In March, the yield on the 3-month Treasury bill slipped below the yield on the 10-year note.
Investors watch the 2-year and the 10-year most closely because they are considered to be the most liquid bond markets, meaning that an inversion would reflect a more widespread bearish sentiment compared to moves in other parts of the curve.
Although its predictive track record is strong since 1969, the yield curve failed to predict recessions in 1954 and 1965. Economists have also pointed out that the yield curve does not in it of itself cause a recession, but rather measures sentiment in the economy in a way that makes it a decent bellwether for one.
This story has been updated to reflect that as measured by the U.S. Treasury, the yield curve (2-year and 10-year) inverted ahead of the last recession as early as December 2005, but that the last time the yield curve literally inverted was in 2007.
The story was also updated to clarify that the yield curve has been a recession indicator over the last half-century, not half-decade as originally described.
Brian Cheung is a reporter covering the banking industry and the intersection of finance and policy for Yahoo Finance. You can follow him on Twitter @bcheungz.
How gas stations and Facebook's Libra pushed the Fed to build a new payments system
The grey area between currency devaluation and currency manipulation
Boston Fed President: No 'clear and compelling' case for this week's rate cut
Congress may have accidentally freed nearly all banks from the Volcker Rule
Read the latest financial and business news from Yahoo Finance

